-
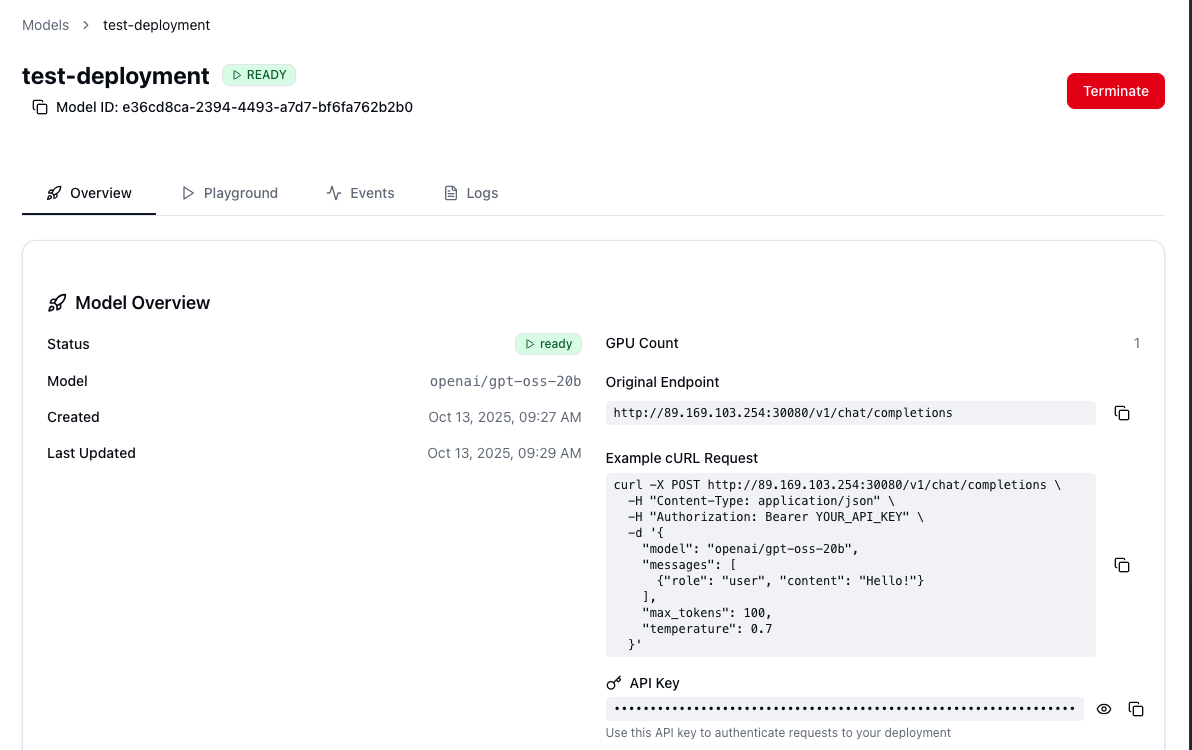
Overview: This is your primary control panel, displaying the model’s status (e.g., “Running,” “Deploying”), its unique endpoint URL, and a sample cURL request to help you quickly integrate it into your applications. Your API key is also conveniently displayed here for easy access.
- Playground: An interactive interface that allows you to send test prompts directly to your model and view the generated output in real-time. This is an excellent tool for quick validation and experimentation without writing any code.
-
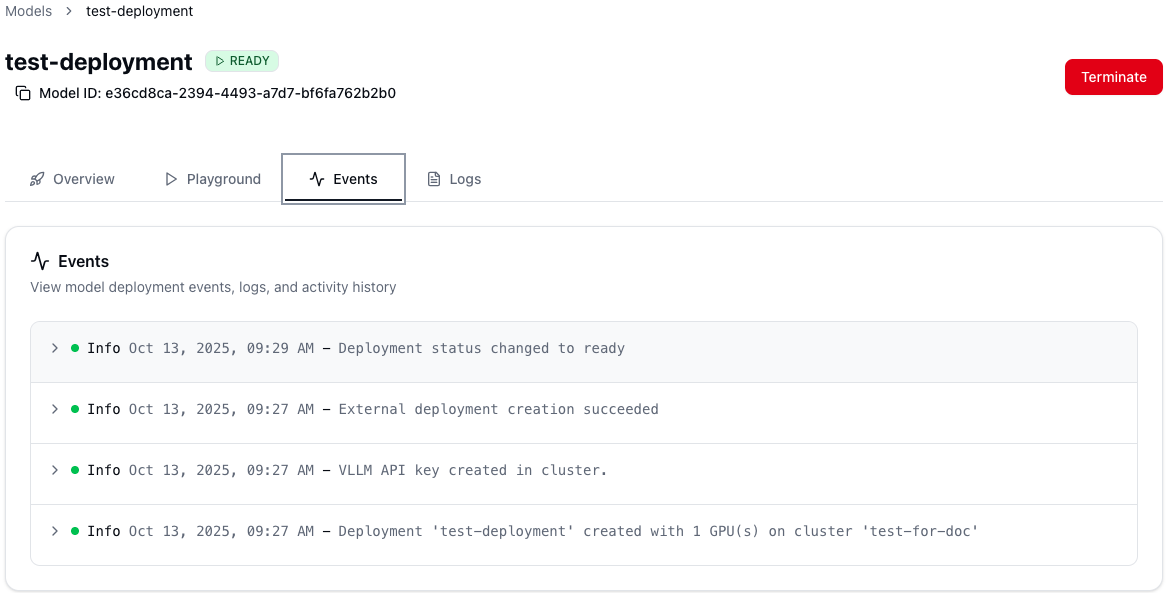
Events: A high-level log of significant activities related to your deployment, such as its creation, status changes, and any system-level notifications.
- Logs: Provides access to the raw, detailed logs from the model’s deployment. This is an invaluable resource for debugging and troubleshooting any operational issues.
Model Management
Using a deployed model
Once your model is deployed and running, you can manage it through a dedicated dashboard.
The dashboard for your active model is organized into several tabs: